Power, Credit and Compute: Our View on the AI Data Center Build-Out


Why power, not chips, now sets the pace of AI, and what that means for how we invest.
Our conclusions, in brief
- Back the bottlenecks. Durable returns accrue to whoever relieves the shortage: on-site power, grid and electrical equipment, cooling, energized and entitled land, and the software and silicon that lower the cost of each unit of AI output.
- Underwrite the tenant, not the building. The same facility can be a 7% investment-grade credit or a 15% distressed one, depending on who the tenant is and how the lease is written.
- Be careful with leverage against fast-depreciating GPUs. If financing tightens, losses are most likely to fall on operators that borrowed against GPUs on customer contracts shorter than their loans, and on the junior capital behind them.
- Treat compute as a commodity input. For the companies we back, compute should be budgeted for volatility and sourced from counterparties chosen with care.
The short version
The AI data center market is not short of demand. It is short of power, and its leveraged edge is now financed by credit markets that have started to price risk.
Hyperscalers are still raising budgets, vacancy is at a record low, and the US power gap is measured in tens of gigawatts. At the same time, credit markets have begun to separate investment-grade builders from leveraged GPU operators, against a 10-year Treasury yield above 5%.
The binding constraints are power, grid interconnection, electrical equipment and local consent, not chips. How the build-out is paid for has also changed: internal cash flow no longer covers it at every hyperscaler, so the cost of capital now matters almost as much as demand.
Six numbers that frame the market
Each of these readings is at or near a record, and together they describe a market limited by delivery and increasingly by financing, not by demand.
Read together: spending is still rising, almost no capacity is spare, power sets the pace of the build-out, the largest US grid cannot procure enough supply even at its price cap, and credit markets are separating investment-grade builders from leveraged GPU owners.
Source: Capex reflects company guidance after Alphabet and Microsoft results of October 28, 2026; Microsoft on a calendar-year basis including finance leases. Other readings: CBRE, Morgan Stanley (via Blockspace), PJM, Forbes analysis of FactSet data, CNBC.
What changed in September and October
The last two months confirmed both halves of our view: physical scarcity deepened across power equipment and memory, and credit markets began charging leveraged borrowers for it while still funding investment-grade tenants at scale.
Key developments, September–October 2026
Source: Company filings and releases; Bloomberg, Reuters, CNBC and other reporting as listed under Sources.
Where value sits in the AI infrastructure chain
Returns in this cycle concentrate where supply is scarcest and lead times are longest. In 2023 and 2024 that was accelerators and advanced packaging; in 2026 scarcity moved down the chain into memory, power equipment, grid access and entitled land, while the layers that own GPUs on borrowed money carry the most balance-sheet risk.
The AI infrastructure value chain: where pricing power sits, October 2026
Source: YXS Capital analysis; company filings.
The mix of spending inside each facility is shifting toward the long-lead layers. Morgan Stanley estimates accelerators are about 52% of the cost of a Rubin Ultra rack, against 71% for Hopper and Blackwell systems. A growing share of each capex dollar therefore flows to memory, power, cooling and electrical infrastructure, which is where we focus.
Demand: who is spending, and how they are paying for it
Demand is contracted and still rising. What has changed in 2026 is that internal cash flow no longer covers the build-out at every hyperscaler, so the marginal dollar is now raised in debt and equity markets.
Big-four hyperscaler capex is guided to about $730B in 2026

Source: Vanguard (2020–2025 reported); 2026E = company guidance midpoints as of October 28, 2026: Amazon ~$220B, Alphabet $195–205B, Microsoft ~$170B (calendar year, including finance leases), Meta $135–145B.
The latest results point to a delivery problem, not a demand problem. On October 28, Microsoft trimmed its calendar-2026 capex to about $170B from about $175B because some third-party capacity deliveries slipped, while Azure grew 48% and is guided to 49–50% next quarter. The same evening, Alphabet reported Google Cloud revenue up 103% to $30.7B and a $561B cloud backlog, reaffirmed its 2026 guidance and said 2027 capex will increase significantly.
Part of the increase is price rather than volume. Microsoft cited roughly $25B of component-price impact, and Amazon attributed a $20B guidance increase to memory prices, so dollar capex overstates growth in deployed megawatts.
“The question for an allocator is not whether aggregate revenue covers aggregate spending, but which balance sheet absorbs the shortfall if it does not.”
Cash flow no longer covers the bill
Meta's third-quarter capex of $34.91B exceeded its $32.79B of operating cash flow, its first negative free cash flow in more than ten years. On October 26 it announced up to $95B of equity: about $35B launched immediately in common stock and mandatory convertible preferred, and up to $60B of at-the-market sales of new non-voting Class C shares from the first quarter of 2027. NVIDIA, AMD and Broadcom expressed interest in buying up to $5B, an example of suppliers financing their largest customers.
Alphabet's third-quarter free cash flow was negative $9.07B, including a $5.2B payment on a 2018 European Commission fine. In June it announced an $84.75B equity program: $34.75B of underwritten common stock and mandatory convertible preferred, a $10B private placement with Berkshire Hathaway, and a $40B at-the-market program to be used over time.
The buyers behind the buyers
The largest incremental buyers of compute are the frontier model developers. Anthropic's S-1, filed publicly on October 26, gives credit markets their first audited view of lab economics: first-half 2026 revenue of $16.3B against $1.16B a year earlier, with compute and infrastructure costs falling to 48% of second-quarter revenue. Its minimum commitments to Google Cloud, Amazon and Microsoft alone total about $269B, and broader tallies that add chip leases and other providers run from roughly $430B to about $800B, depending on what is counted.
OpenAI told investors its run rate was approaching $50B at the end of September, against a target of at least $70B by year-end, and is not expected to list until 2027. Against all of this, Gartner calculates that AI data center owners need $8.5T of cumulative revenue through 2030 to earn a 12% return, versus up to $3.6T it expects to be attributable to them.
We think the revenue-gap analyses are right about the risk and wrong to treat it as evenly distributed. Diversified hyperscalers can absorb write-downs; single-purpose, leveraged owners of GPUs and the junior capital behind them cannot. The question for an allocator is not whether aggregate revenue covers aggregate spending, but which balance sheet absorbs the shortfall if it does not.
Power: the binding constraint
Speed to power is the scarcest asset in the AI supply chain, and it is being priced accordingly. Morgan Stanley's September revision is the most detailed public estimate of the gap.
33 GW of US data center power need remains unserved through 2028
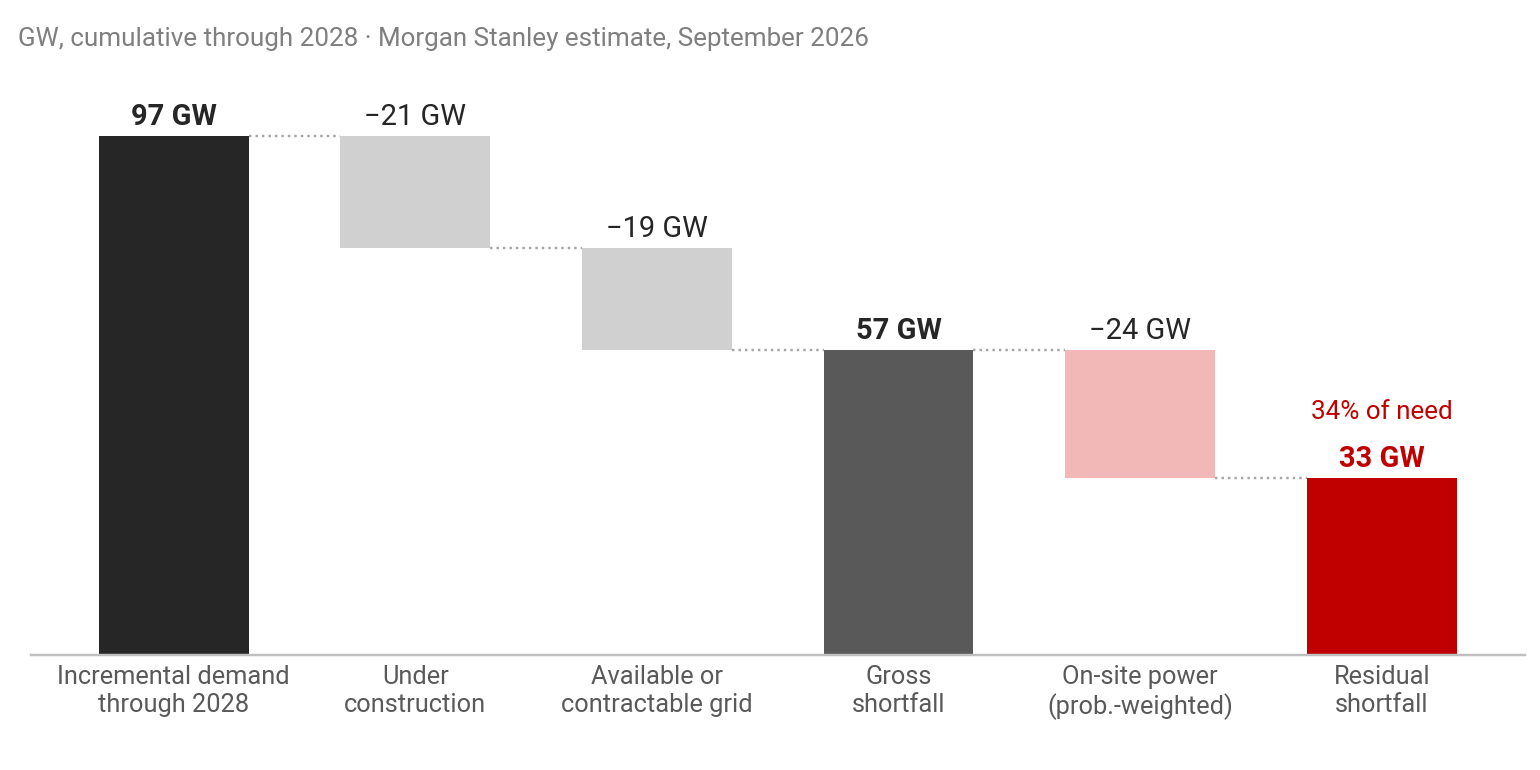
Source: Morgan Stanley Research, September 21, 2026, as reported by Blockspace. Model estimates, not utility-approved load. On-site solutions weighted at 90% (turbines, engines, fuel cells) and 75% (nuclear co-location).
The gap widens over time: the cumulative shortfall rises from 5 GW in 2026 to 12 GW in 2027 and 33 GW in 2028, and extending the model through 2029 lifts it to 72 GW. The revision was driven by higher chip shipment estimates and denser racks, with Morgan Stanley now assuming 234 kW per Vera Rubin rack and 600 kW per Rubin Ultra rack.
Interconnection is measured in years
About 2,061 GW of generation and storage sat in US interconnection queues at the end of 2025, according to Lawrence Berkeley National Laboratory. Only 13% of the capacity that requested interconnection between 2000 and 2020 had reached commercial operation, and the median project completed in 2025 spent roughly five years in the queue. Natural gas in the queues rose 86% to 253 GW as developers turned to dispatchable supply.
Grid access is only one of several long-lead routes to power. Set side by side, they explain why sites with existing substations, reserved turbines or fast on-site engines command a premium.
Outside small engines, securing power now takes three to seven years
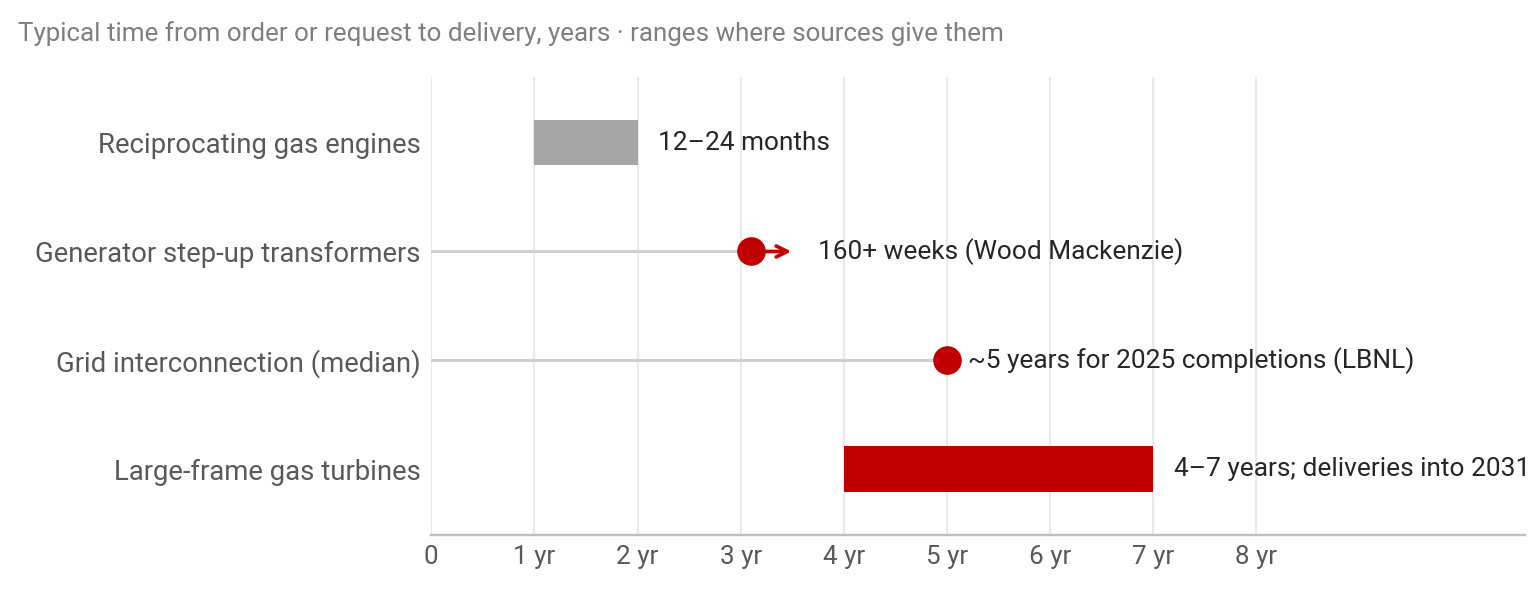
Source: Wood Mackenzie data via Reuters (generator step-up transformers, Q1 2026); Lawrence Berkeley National Laboratory, Queued Up 2026 (interconnection); Bloomberg and industry reporting, October 2026 (turbines, reciprocating engines).
Equipment is sold out for years
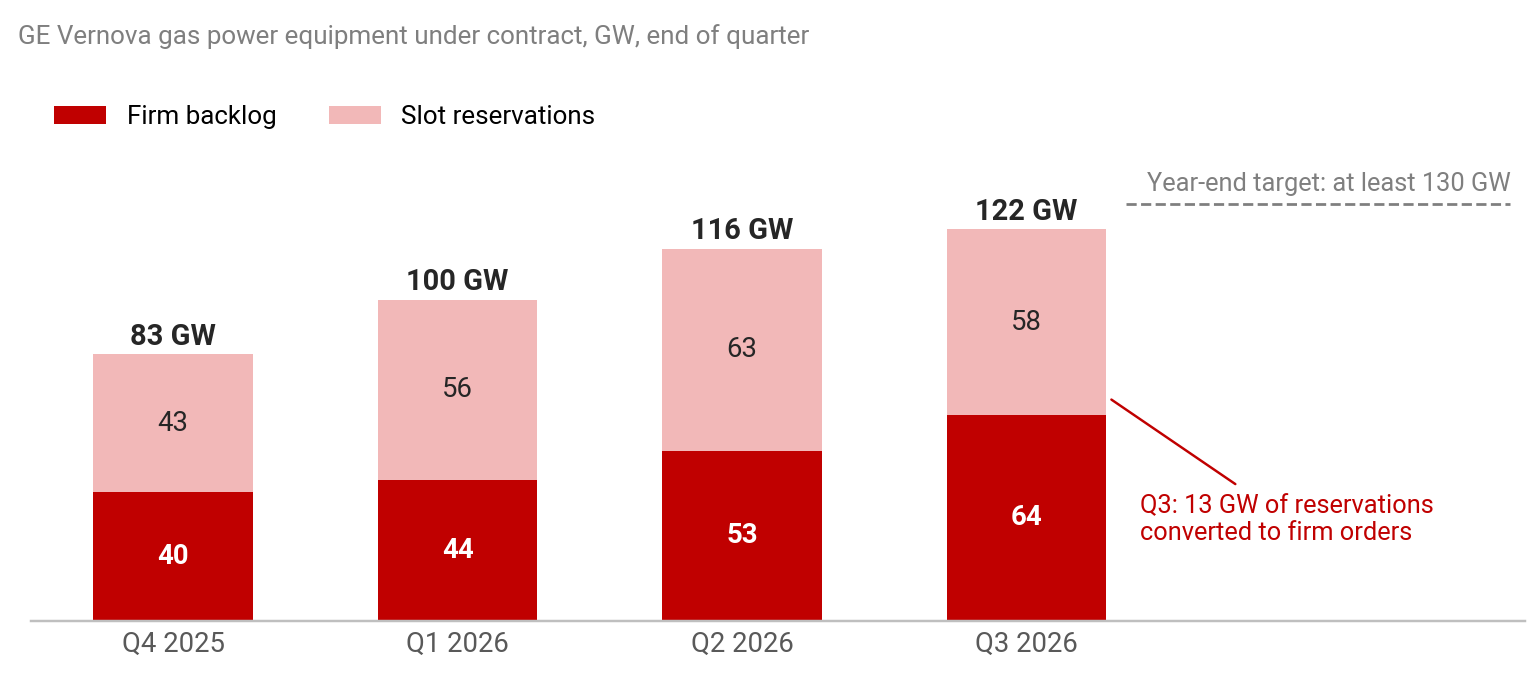
GE Vernova ended the third quarter with 122 GW of gas equipment under contract, 64 GW of firm backlog and 58 GW of slot reservations, against an annual output rate of about 20 GW: roughly six years of production at one manufacturer. It converted 13 GW of reservations into firm orders in the quarter and expects at least 130 GW under contract by year-end. Conversion matters because slot reservations are paid positions in a manufacturing schedule; when they harden into orders, announced capacity is becoming real.
GE Vernova's gas queue keeps growing, and reservations are turning into firm orders
Source: GE Vernova quarterly results (Forms 8-K), first through third quarter 2026.
The shortage runs the length of the electrical chain. Mitsubishi Power said on October 27 that demand is pushing its turbine deliveries out to 2031, with its large-frame backlog at 35 GW against 23 GW a year earlier. Wood Mackenzie data show generator step-up transformer lead times above 160 weeks and US transformer supply running about 15% short this year, so a substation ordered today may not arrive before 2029.
Capacity markets and the ratepayer
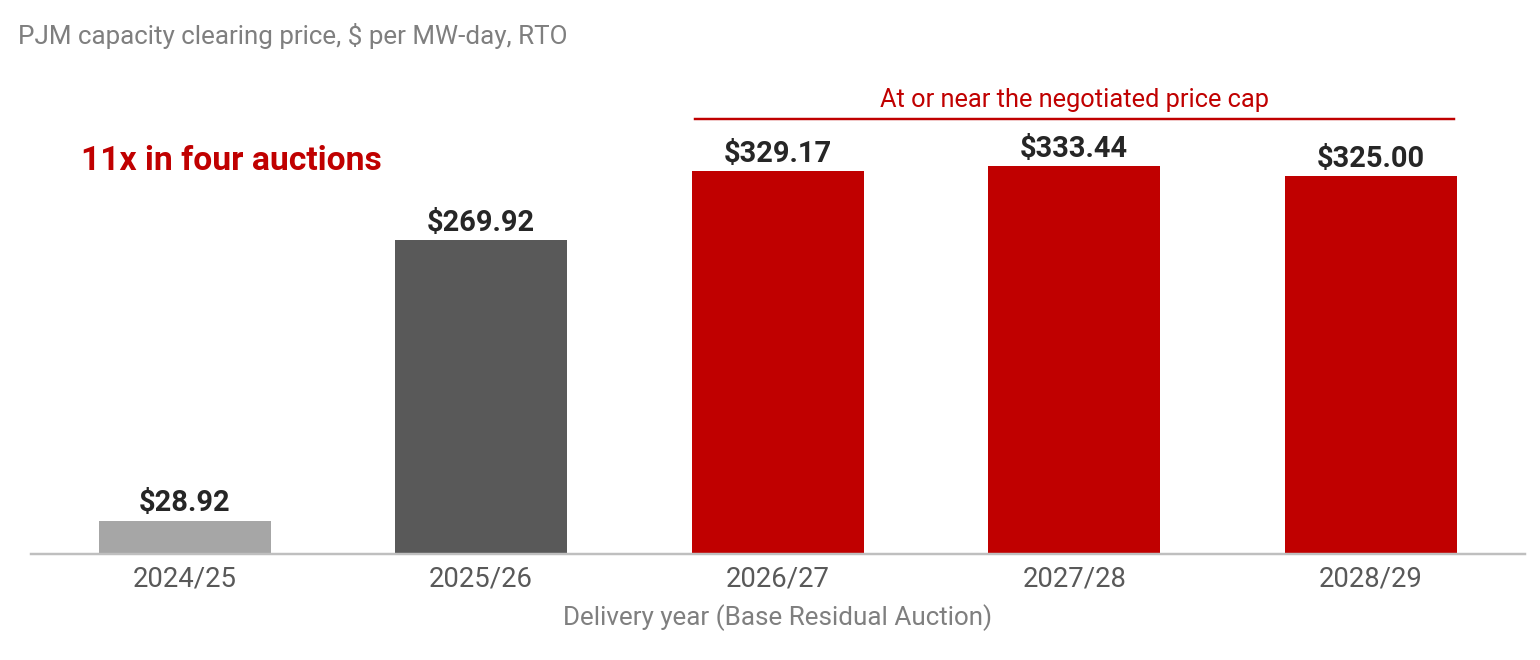
PJM, which serves 67 million people across 13 states and Washington, D.C., is where data center load meets household electricity bills most directly. Its July auction for 2028/29 cleared at its price cap for the third straight year and still fell 6,831 MW short of its reliability requirement, and its independent market monitor attributes $6.3B, or 38%, of the auction's charges to data centers.
PJM capacity prices are up 11x in four auctions
Source: PJM Interconnection; OPIS. Base Residual Auction clearing prices for the RTO.
Policy: bring your own power
Federal policy is converging on a consistent principle: large new loads should bring generation with them and bear the grid costs they create. FERC directed grid operators in June 2026 to revise or justify their large-load interconnection rules. On October 21, President Trump said new large data centers must generate their own electricity, give or sell any excess to the local community or grid, and pay host communities a "dividend."
We read the direction as constructive for the build-out. It gives developers a path that does not depend on multi-year queue positions and aligns speed to power with ratepayer protection. It also raises capital intensity per megawatt and shifts execution risk to developers, which favors sponsors with access to turbines, gas supply and balance sheet.
Physical capacity: vacancy, construction and local consent
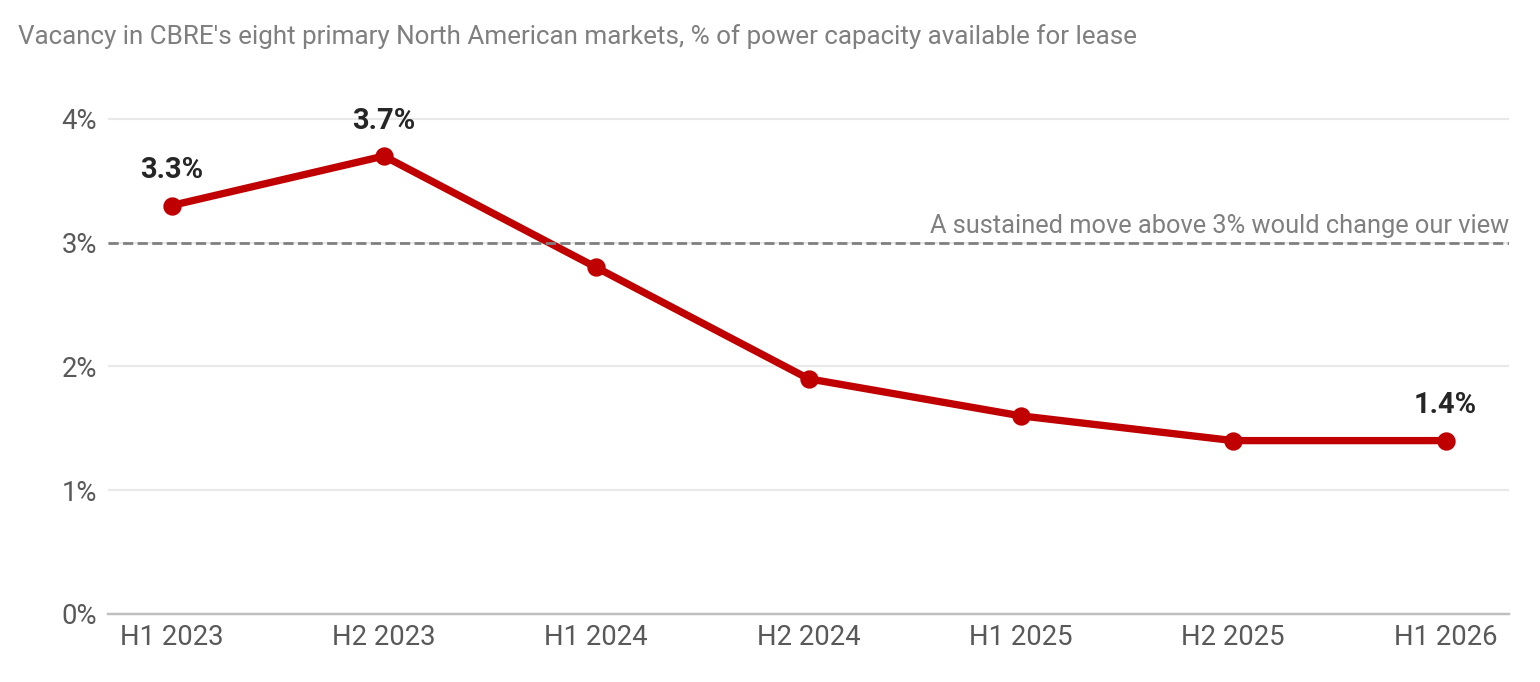
Supply is growing at a record pace and still not keeping up. Primary-market supply grew 33.7% year on year to a record 10,903 MW in the first half of 2026, yet vacancy kept falling.
North American data center vacancy is at a record low of 1.4%
Source: CBRE Research, North America Data Center Trends (H1 2023–H1 2026); Data Center Dynamics. Markets: Northern Virginia, Dallas–Fort Worth, Silicon Valley, Chicago, Phoenix, New York Tri-State, Atlanta, Hillsboro.
Capacity under construction rose to a record 7,481 MW, of which 80.4% is preleased, leaving less than 1,500 MW available, or about six months of demand at the current absorption rate. Northern Virginia, the largest market, has vacancy of 0.2%, and asking rents rose across every requirement size.
Delays are real; cancellation headlines overstate the case
Sightline Climate estimates that only about 5 GW of roughly 16 GW of US capacity slated for 2026 was under construction early in the year, while SemiAnalysis argues the tracker undercounts third-party construction. Microsoft's October 28 capex shortfall, which it attributed to delayed third-party capacity deliveries, is a current example of delay rather than cancellation.
We draw three conclusions. Most of what is reported as cancellation is delay, driven by power, equipment and permitting rather than by tenants walking away. Delays defer revenue while interest accrues, which concentrates risk on construction lenders and on developers without signed leases. And delay is itself a source of pricing power for capacity that does arrive on time.
Local consent is now a credit factor
S&P Global Ratings tracked 146 delayed or canceled US projects, about three-quarters of them linked to local pushback, and highlighted moratoriums in New York, Texas, Pennsylvania, Illinois and Arizona. An Annenberg survey found 61% of US adults oppose a new data center nearby.
Loudoun County, Virginia shows how far this has moved. Amazon paid about $427.3M in March for a 122-acre campus in Ashburn, then agreed on October 20 to withdraw its application and rezone the land for mixed use with a prohibition on data centers. The county board is moving toward a pause of up to a year on new applications, with a vote expected on November 17.
In the market with the deepest power and fiber infrastructure in the world, entitlement risk is now underwritten alongside power risk, and campuses with existing approvals command a premium.
Compute economics: rising rents, falling token prices
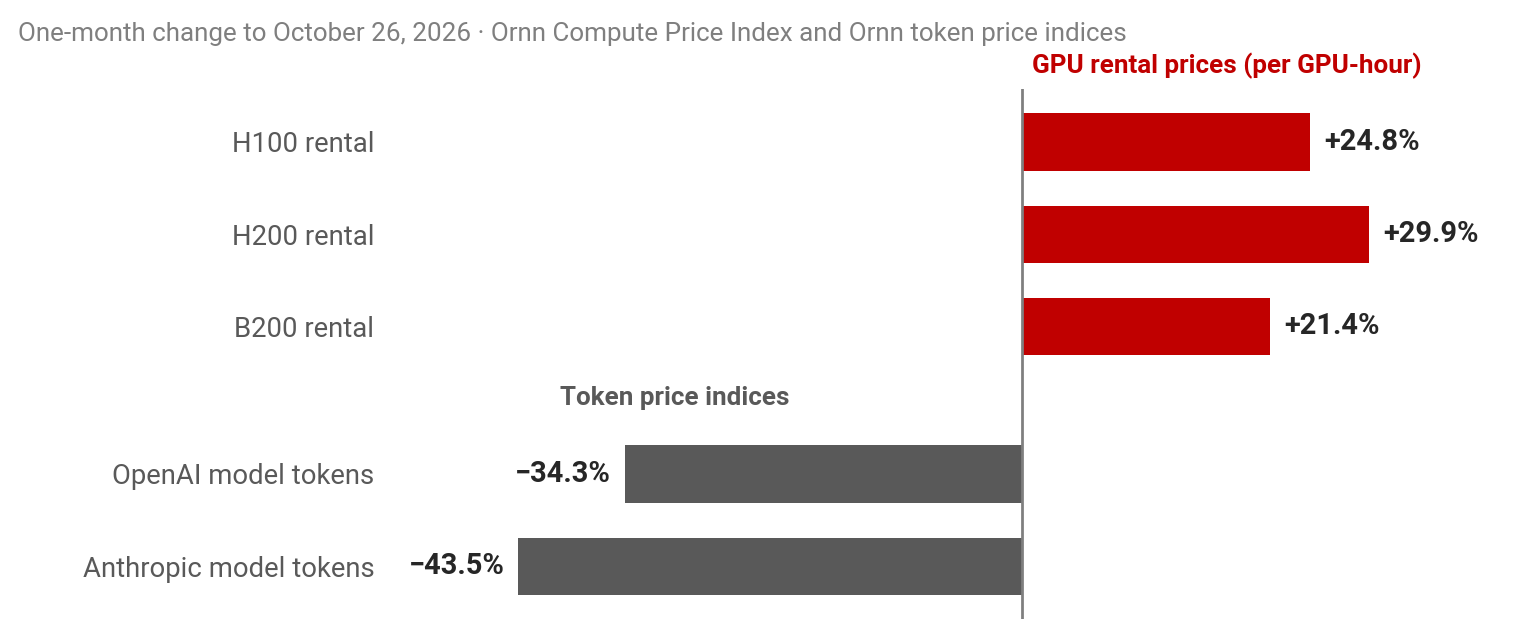
The cost of AI inputs is rising while the price of AI output falls, and the spread is being absorbed by model developers through efficiency gains and by inference resellers through margin.
GPU rents rose 21–30% in a month while token prices fell 34–44%
Source: Ornn Compute Price Index, settlements of October 25–26, 2026. GPU figures are transacted rental prices per GPU-hour; token indices are volume-weighted blends of posted per-token prices.
On the Ornn index, H100 settled at $3.17 per GPU-hour on October 26, H200 at $6.21 and B200 at $9.76. Silicon Data's H100 neocloud index rose about 44% between December 2025 and October 24, and Nebius raised its on-demand H100 price from $3.85 to $4.50 on October 1. Hyperscaler pricing remains well above neocloud pricing, with median H100 rates of about $7.89 per hour against $4.17.
For a GPU owner the near-term effect is favorable. At the current B200 index price, one GPU at 70% utilization generates about $60,000 of annual rental revenue, against about $49,000 at the index level a month earlier (our arithmetic). The same arithmetic runs in reverse when new supply arrives, which is why we set collateral values on GPU loans on a declining price curve rather than at spot.
Density, memory and depreciation
Each NVIDIA generation raises power per rack and capital per facility while lowering the cost of a unit of compute. At densities approaching 600 kW per rack, liquid cooling and higher-capacity electrical equipment become mandatory, and facilities designed for air-cooled racks face functional obsolescence for frontier training.
Memory has become the second bottleneck after power. TrendForce expects conventional DRAM contract prices to rise a further 10–15% in the fourth quarter after 13–18% in the third, and estimates that HBM and server modules take 51% of DRAM bit supply in 2026.
The shortage deepened in October. SK hynix reported a record quarter on October 28 and said its HBM and DRAM output is sold out through 2029, that HBM demand is roughly double what it can supply, and that the shortage is likely to last through 2030. KB Securities estimates Samsung has already locked in about 80% of its 2027 memory output under long-term agreements, so buyers without supply contracts now face allocation risk, not just price risk.
Accounting lives for GPU servers range from four years at Nebius to six at Alphabet, Microsoft and CoreWeave; Alphabet said about 65% of its third-quarter capex went to servers and networking depreciated over six years. We regard the debate as secondary for hyperscalers and primary for lenders. A100s, launched in 2020, still rent for about $1.00–1.09 per hour, which supports a multi-year economic life at declining prices but not debt that relies on residual value at today's rates.
Financing: the capital stack moves down the credit curve
The build-out is now financed across five tiers: operating cash flow, investment-grade corporate debt, off-balance-sheet project structures, asset-backed and secured lending, and, new in this cycle, common and preferred equity at hyperscale. Credit markets are pricing the difference between them.
About half of the $2.9T build-out needs outside capital, led by private credit
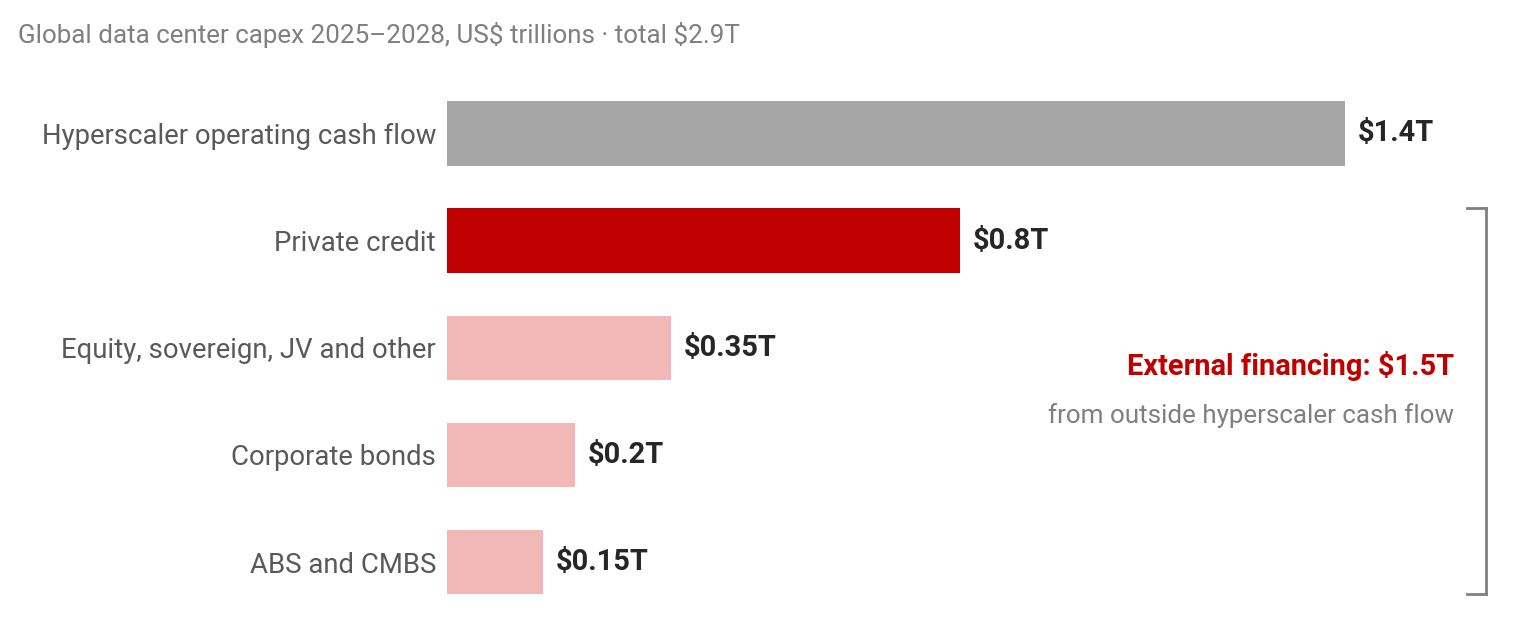
Source: Morgan Stanley Research framework for $2.9T of global data center capex, 2025–2028. "Equity, sovereign, JV and other" derived by YXS Capital as the balance of the $1.5T gap after private credit (~$0.8T), corporate bonds (~$0.2T) and ABS/CMBS (~$0.15T).
“The same facility can be a 7% investment-grade credit or a 15% distressed one, depending on who the tenant is and how the lease is written.”
Alphabet, Amazon, Meta and Oracle had issued more than $228B of bonds in 2026 by mid-October. Of roughly $80B of US data center bonds issued this year, about $37B is rated below investment grade, more than four times the 2025 total, and average yields on that cohort approached 10% in October.
Deals in September and October show the split in practice. CleanSpark sold about $2.25B of high-yield bonds backed by a 20-year Meta lease and drew about $10B of orders, while a Blue Owl-sponsored developer paid about 9.25% on $1.1B of five-year notes for a CoreWeave-leased Virginia site, roughly 2.7 percentage points above similarly rated debt. Lenders led by JPMorgan and MUFG were still selling down the record $38B construction loan for Oracle-leased Vantage campuses, some at a discount to non-bank buyers, and by mid-October junk and investment-grade yields had reached their highest levels since 2025 and 2023 respectively.
The tenant sets the coupon: data center debt now prices from about 7.5% to 16%
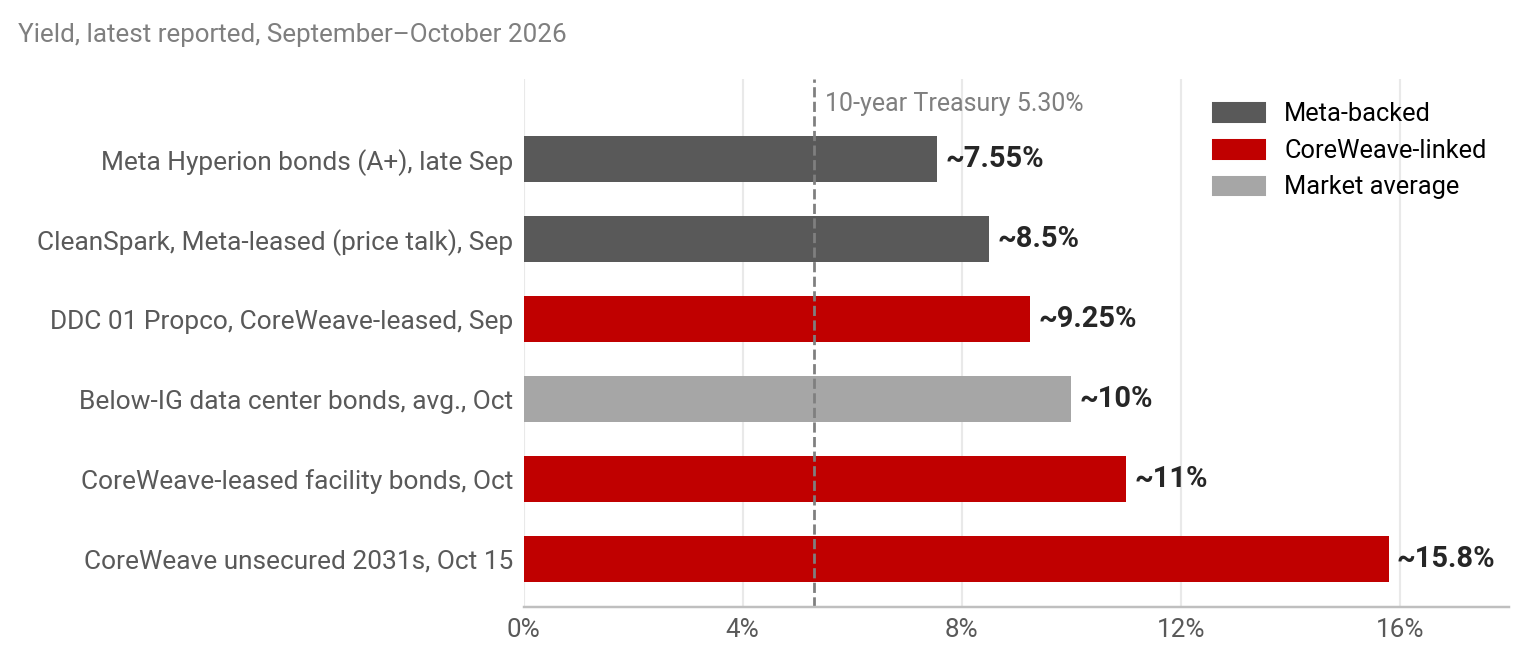
Source: Meta Hyperion: Reuters column via The State of AI; CleanSpark: initial price talk via Crypto Briefing; DDC 01 Propco: Bloomberg; below-investment-grade average and CoreWeave-leased facilities: Forbes analysis of FactSet data; CoreWeave notes: CNBC and LSEG; 10-year Treasury: October 7 auction. Yields are approximate and measured on different dates.
Official-sector attention has followed. The IMF's October 13 Global Financial Stability Report named an AI-driven market correction as one of three salient risks to financial stability, and noted that large cloud and data center operators accounted for about 10% of global investment-grade corporate issuance by July 2026, against less than 1% at the end of 2024.
Securitization is becoming the takeout market for stabilized facilities: Barclays estimates outstanding data center ABS and CMBS grew from $4B in 2020 to $61B in 2026. The structural point is refinancing exposure, because data center ABS typically concentrate principal repayment at an anticipated repayment date about five years after issuance, at a point in the credit cycle no one can know in advance.
Suppliers are also financing their customers. Besides NVIDIA, AMD and Broadcom's interest in Meta's equity offering, Anthropic's S-1 shows Broadcom committing $42B of notes to cover fees under a TPU chip lease, with 9% interest capitalized rather than paid in cash. We treat such arrangements as credit enhancements whose value depends on the supplier's continued willingness, not as substitutes for diversified demand.
The rate backdrop
The cost of capital rose just as external financing became necessary. The October 7 auction of 10-year Treasury notes required a 5.30% yield, and the Federal Reserve left rates unchanged on October 28. A 15- to 25-year fixed-price lease underwritten at a 15–19% unlevered yield retains a margin of safety; junk-rated project debt at 10–11% leaves little room for delay or re-leasing at lower rents.
Four case studies
Four case studies in data center credit
Source: Company filings; S&P Global Ratings; Reuters, Bloomberg, CNBC and other reporting as listed under Sources.
Three scenarios for the next twelve months
Our central case is a market that stays physically tight and financially bifurcated. The weights below are indicative judgments, not forecasts, and we revisit them as the signposts move.
Scenario framework (indicative weights, October 2026)
Source: YXS Capital. Weights are indicative judgments, not forecasts of outcomes.
In the central case, construction delays and local restrictions keep pushing capacity toward sites with existing power, on-site generation and converted campuses, and consolidation among leveraged GPU clouds becomes more likely. Gartner expects more than 80% of neoclouds to lose independent operation by 2030.
Beyond twelve months our views are conditional. If on-site generation and interconnection reform shorten time to power, the binding constraint shifts toward equipment and labor. If model-developer revenue keeps compounding near 2026 rates, the revenue gap closes faster than consensus assumes; if it does not, write-downs concentrate in leveraged GPU owners and junior project finance. Either way, we expect gigawatts delivered, rather than dollars committed, to become the market's preferred measure of progress.
Key risks we monitor
The risks we rate both likely and high-impact over the next twelve months are linked: a model-developer revenue shortfall would transmit through concentrated backlogs into neocloud refinancing, GPU residual values and junior credit at the same time.
Four linked risks sit in the likely, high-impact quadrant

Source: YXS Capital assessment, October 2026. Shaded area marks risks rated both likely and high-impact over the next twelve months.
Events since we made this assessment have reinforced the shaded quadrant rather than moved it. Microsoft's delayed third-party capacity is the delay risk playing out, and CoreWeave's bond selloff is the refinancing risk being priced in real time.
How we underwrite data center and compute exposure
Tenant quality and lease terms, more than location, explain most of the gap between a 7% data center bond and a 15% one. For investors new to the theme, the simplest version of our framework is one question: if AI revenue disappoints, whose balance sheet absorbs the shortfall? We apply the ten tests below across credit, real assets and equity, and to the compute contracts of the companies we back.
Underwriting checklist for data center and compute exposure
Source: YXS Capital.
What this means for different investors
- Credit investors. Price the tenant and the lease, not the location. In GPU-backed lending, amortize inside the customer contract and value collateral on the assumption that each annual NVIDIA generation lowers the rental value of the last. Treat supplier backstops, such as capacity purchase agreements, as credit enhancements whose value depends on the supplier's continued willingness, not as substitutes for diversified demand.
- Real-asset investors. The scarce asset is energized, entitled land; the building is the replicable part. Underwrite time to power explicitly, test returns against delay scenarios rather than delivery schedules, and require a liquid-cooling path for any facility marketed for AI training.
- Equity and venture investors. Prefer businesses whose revenue scales with gigawatts deployed regardless of who owns the GPUs: power generation and grid equipment, thermal and electrical systems, and the software and silicon that lower cost per token. Test pricing power against backlog quality, since slot reservations and orders can be canceled if financing tightens, and be cautious with any company whose largest customer is a leveraged neocloud.
- Companies buying compute, including our portfolio. Treat compute as a volatile commodity input. Budget for rising rather than falling prices on the newest GPUs over the next year; reserve capacity for core workloads and use on-demand capacity for peaks; avoid dependence on a single leveraged provider; negotiate portability and termination rights; and report compute as a share of revenue alongside an efficiency plan. If distress releases cheap capacity, short commitments on non-core workloads let a company benefit.
How compute plays out, and where our portfolio fits
We expect compute to split into two markets with different economics. Frontier training and large-scale inference concentrate in giga-scale campuses owned or leased by the best-capitalized buyers. A fast-growing tier of efficient inference moves onto phones, PCs, vehicles and robots, where the constraints are latency, memory, power draw and privacy rather than grid interconnection.
Three observations drive that view:
- Frontier training gets more capital-intensive per facility, even as compute gets cheaper per unit. Morgan Stanley's illustrative 100 MW facility costs $5.245B built around Rubin Ultra, against $3.469B for Hopper, while capital cost per teraFLOP falls 94%. Only the largest balance sheets, and their financing partners, can build at that scale.
- Inference is where volume grows and where price competition is fiercest. Margin accrues to whoever lowers the cost of each unit of output: better models, better software, or running the workload somewhere cheaper.
- Every workload that runs well at the edge is one that does not compete for 1.4%-vacancy data center space or a five-year interconnection queue. Edge inference does not need a new substation.
“Every workload that runs well at the edge is one that does not compete for 1.4%-vacancy data center space or a five-year interconnection queue.”
Liquid AI: the efficiency layer
Liquid AI, a YXS Capital portfolio company founded in 2023 by MIT scientists, builds Liquid Foundation Models designed to be efficient by architecture rather than by compressing larger models. Its LFM2 family, released in July 2025 and followed by LFM2.5 in January 2026, targets on-device deployment; VentureBeat reported CPU throughput roughly 2x that of comparable open models in many cases. In January 2026, AMD demonstrated a fine-tuned Liquid model summarizing meetings privately on a Ryzen AI 400 Series processor.
This is the segment our framework rates overweight: when token prices fall faster than compute costs, value accrues to the companies that make each token cheaper to produce, and on-device models move workloads out of the most constrained part of the chain entirely. The principal risks are the pace at which incumbents replicate these efficiency gains, and the fact that small on-device models do not replace frontier models for the hardest reasoning tasks.
Wayve: embodied AI as a distributed compute market
Wayve, the London-based developer of end-to-end embodied AI for driving, shows how physical AI changes the shape of compute demand. Its models learn from large volumes of driving data in the data center, then run on in-vehicle silicon from multiple chipmakers. Wayve closed a $1.2B Series D in February 2026 at an $8.6B post-money valuation, led by Eclipse, Balderton and SoftBank Vision Fund 2, with Microsoft, NVIDIA, Uber, Mercedes-Benz, Nissan and Stellantis participating. In April, AMD, Arm and Qualcomm Ventures added $60M to support running its AI Driver across their automotive platforms, and robotaxi pilots with Uber are planned in London and, with Nissan, in Tokyo.
For our compute thesis, the point is structural: embodied AI adds training demand to centralized compute while distributing inference across millions of vehicles, and a hardware-agnostic software layer lets automakers choose silicon rather than be locked to one supplier. Commercial scale still depends on regulatory approvals and on the outcome of its planned robotaxi pilots.
What we look for next
We apply the same lens to new opportunities: businesses that relieve a physical bottleneck, lower the cost per unit of AI output, or move workloads out of the most constrained part of the chain, financed by capital structures that do not depend on refinancing short contracts against fast-depreciating hardware.
Where we lean, and what we are watching
Durable returns in a capacity shortage accrue to whoever relieves it; losses in a financing squeeze accrue to whoever borrowed short against fast-depreciating assets. Our stance by segment follows from that.
Where we lean: stance by segment
Source: YXS Capital.
Catalysts ahead
Catalyst calendar
Source: Company announcements and press reports.
What would change our view
Monitoring dashboard
Source: Sources as cited in the text.
Terms used in this article
About the author. Sunny Patel is Co-Founder & Managing Partner of YXS Capital, a Miami-based venture capital firm.
Sources
Company results and filings
- Alphabet Q3 2026 results (Form 8-K)
- Alphabet Q3 2026 coverage, CNBC
- Alphabet equity capital raise, June 2, 2026 (Form 8-K)
- Microsoft fiscal Q1 2027, Fortune
- Microsoft third-party delivery delays
- Meta Q3 2026 Form 10-Q
- Meta equity raise (Reuters)
- Anthropic S-1 coverage, PPC Land
- NVIDIA fiscal Q2 2027 results
- GE Vernova Q1 2026 results
- GE Vernova Q2 2026 results
- GE Vernova Q3 2026 results
- SK hynix Q3 2026, Korea Times
- SK hynix Q3 2026 (Reuters)
- OpenAI run rate, Value Add VC
Capex, forecasts and policy
- Vanguard, hyperscaler capital expenditures
- Gartner, October 14, 2026
- IMF Global Financial Stability Report, October 2026
- IMF issuance share, EconoTimes
- President Trump's October 21 statement, via the Wall Street Journal
- FERC large-load order, JD Supra
- FOMC decision, investingLive
- Treasury yields, Wolf Street
Power and physical capacity
- Morgan Stanley power shortfall, via Blockspace
- Lawrence Berkeley National Laboratory, Queued Up 2026
- PJM 2028/29 auction results
- Mitsubishi Power turbine deliveries
- Transformer lead times (Wood Mackenzie via Reuters)
- US transformer supply gap
- CBRE North America Data Center Trends H1 2026
- Sightline Climate, via Utility Dive
- SemiAnalysis
- S&P on local pushback, Insurance Journal
- Amazon in Loudoun County, 24/7 Wall St.
Compute, memory and credit
- Ornn Compute Price Index
- Samsung 2027 memory contracts
- Forbes on neocloud debt
- CoreWeave debt and backlog, InsiderFinance
- CoreWeave rating and LSEG bond data, investingLive
- CoreWeave yields, FourWeekMBA citing CNBC
- Bloomberg on junk and investment-grade yields
- Blue Owl-sponsored CoreWeave-linked notes, Bloomberg
- CleanSpark high-yield bond for Meta campus
- Oracle-linked loan sell-down
- Record investment-grade issuance
- S&P on Oracle, PPC Land
- Meta Hyperion bonds, The State of AI
- SpaceX and Apollo (Reuters)
- Data center ABS and CMBS, Structured Finance Association
Portfolio and companies
- Liquid AI, LFM2
- VentureBeat on LFM2
- AMD and Liquid AI
- Wayve Series D, AI Magazine
- Wayve Series D extension, Technobezz
Figures marked "our arithmetic" are YXS Capital calculations from the cited inputs. Data as of October 29, 2026.
Important disclosures
This article is provided by YXS Capital Management LLC and its affiliates ("YXS Capital") for informational purposes only. It is not an offer to sell or a solicitation of an offer to buy any security or any interest in any fund or investment vehicle, and it is not investment, legal, tax or accounting advice. References to specific companies are for illustration and are not recommendations.
Information has been obtained from company filings, research providers, press reports and other sources believed to be reliable, as cited; YXS Capital has not independently verified all of it and makes no representation as to its accuracy or completeness. Third-party estimates and forecasts are the views of their authors. Statements about future events, including scenarios and indicative weights, reflect current views and assumptions, involve risks and uncertainties, and may differ materially from actual outcomes. YXS Capital undertakes no obligation to update them.
YXS Capital, its affiliates, personnel and clients may hold positions in, transact in, or have business relationships with companies discussed in this article, including Liquid AI, and may do so in a manner inconsistent with the views expressed. Past performance is not indicative of future results.